
- Reviewing personal content performance in May 2022
- Finding opportunities for new and better content
- Comparing time periods for performance and rising content
- Data from Google Search Console, LinkedIn & Google Analytics
- The value of well-produced legacy content
#googleanalytics #google #googlesearchconsole #linkedin #videomarketing #videocontent #linkedincreators #seo #youtubeseo #youtube #data #content #opportunities
Resources
https://search.google.com/search-console/about
YouTube Video
Automated Transcription
Hello hello Tyler Bryden here. OK it’s the start of new month. It’s June 2022 or six months into 2022. What a crazy ride it’s been and today I thought it would be interesting to take a look through the performance of my personal assets online and give you sort of a a journey that I would be taking when I review something a little buddy. To take A to review a month, start to prioritize and strategize on what I should be doing in the in the the next month and how we’re sort of look at this analytics layer around all the personal content that I’ve been creating.
For your context, I’ve been creating almost a video a day. I think about 30 videos last month, maybe a little bit less than that, just on the weekends and stuff. Posting that website, which then distributes the podcast you’ve got LinkedIn, and you’ve got YouTube. I gave up on Tik T.O.K and give up on Tick Tock but tick tick Tock obviously is about short clips, punchy, impactful, and I was finding the process of clipping and getting it to talk too much time. I’m spending too much time on this already, well, that’s that’s dependent, that’s.
I guess that personal thing I I’m really enjoying it. I’m learning a lot and some new things that are coming up for me. So I’m going to walk through some of the analytics that I look at the end of the month sort of give you my thought process. It maybe you’ll learn something from the way that I’m looking at it. And if you have any other strategies or things that uncover insights or content opportunities, would love to hear. I think this is super interesting and obviously the thing that all businesses are looking at today. So I’ll share my screen. First of all, I’ll hop into what Google search console.
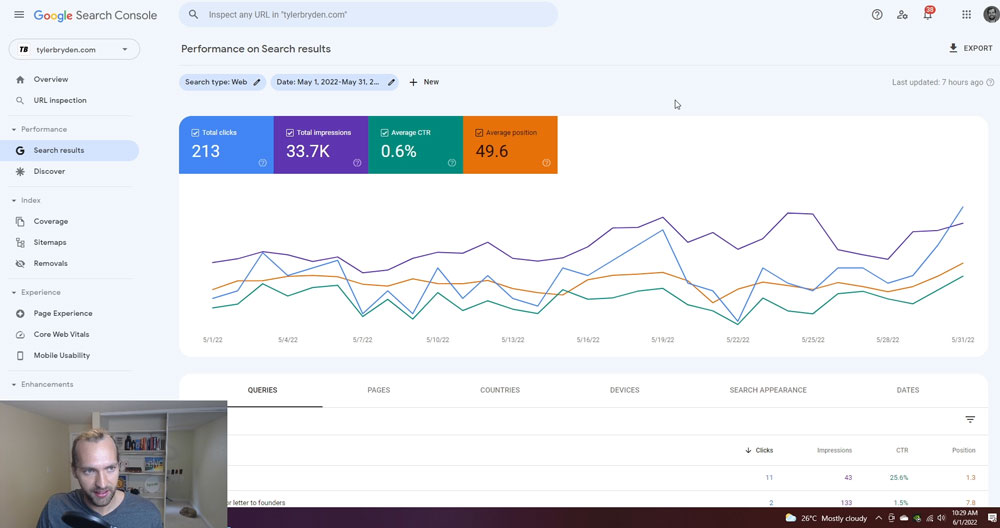
Has released a sort of. They’ve got this new sort of site overview, so this is. I mean this is pretty high level insights from the last 28 days. You can’t even filter. I’ll show you the more deeper performance level, but you can start to see the most searching queries and the most trending queries and then even it only shows 5 at once. But you can start to see which ones are getting clicks and then it will give you a little indicator here if you’re in the top five results. You’ve also got the most trending query, so I published a video why Combinator letter to founders?
Posted that on the website. With that the URL structure then populates on the website and that is actually driving a considerable amount of new clicks to the site and on a very specific sort of high intent topic for an audience that personally I’m interested in connecting and communicating with, and that’s been, I think, a great outcome of this process that I’m on. This content creation process it’s allowing me to connect with other people and I will say there is this sort of analytics layer that I’m looking at. You can look at the performance and think oh this is great performance. This bad performance, but there’s also this intuitive feel and I think this is really important. Is is this building credibility? Is it connecting you with people who you want to be connected with? Is this spurring? Spurring conversations? There’s all these questions that we can ask to feel like is this time investment worth it? And for me it is worth it. And outside of some of the analytics that I’m going to walk through right now, some of the conversations are outreach referrals. They have been very worthwhile.
In the last month and makes me want to continue on this journey. So just in your own content journey, make sure that you take that into consideration, because sometimes the numbers don’t always look that fun. You don’t think you’re necessarily making that big of an impact, but it could be a few people that see your content or or get engaged and that could be a big difference for for your business. So on the more deeper level of Google Search console, this is the the more in depth report and what I’ve done Dick in the state range looked at May 1st to May 31st. And then I can now see the queries. I can see the average click through rate and then the average position of that. So you know, from a simple level usually generally want you can export this into a CSV, but generally you want to do a couple just filtering to see high level. What were the the most clicks that were had here? I just want to see. So you’ve got queries. You’ve got pages so you can see the most clicked pages. I wrote this like this is a legacy post from like 2019 that continues to get Amazon merch.
As practices, but now you can see, I just posted this this month and already driving quite a few impressions and clicks and I had a pretty high position here as well too. So you can see like a lot of these contents like this. This post is turning milestones of turning 26 years old and continues to rank and drive traffic today and that’s why I do encourage people to print together this content creation process and a lot of times it won’t even hit right away. It might be months or years. Before it starts to hit, but you can start to see some really interesting things, and then if you have the right triggers and calls to actions and things like that, there’s a lot of opportunity. So I’m looking at all these searches. Great, it gives me some ideas on on possibly what is working, what’s not working, maybe even pages that I should be optimizing for for better CTA or just improving the page. And and you know, updating content refreshing content is a great way to then continue to see page content be ranked on search engines, but one thing I’d like to do.
I’d like to say I’d like, you know I’m just going to go the last 28 just in terms of speed, but do a little bit of a comparison. So I look at the last 28 days and see the difference that I do year over year. I think I did. I did year over year last 28 days compared to previous. And you can start to see that little bit of a difference here and now. What I like to do at this point is I’d like to see are there any clicks or impressions that had a big difference in this time period. So in this case I can see a couple ones that had a little bit more clicks. Again, these are very small numbers, but then I can also do the same thing in impressions. So I wrote a post about and I think actually this was just a post, but about finding the best email Finder tool, there was literally no impressions the previous 28 days and now we’re already at almost 200 and you can start to filter.
And see the gains there. Obviously again I can filter and say I want to look at more of these results and and do that and then you can actually, you know, scan down, find some opportunities and look if there’s any areas that there are big trending up ones and figure out how can I fortify that content? How can I write more content around it? How can I increase it even further? And then you’ve also got another one here where you can see sort of the position difference. So what position was it in 28 days ago and then what?
Position is it in now and and zero generally, meaning it wasn’t ranking. And now you’ve got the opportunity to see. Where it is sitting now and then I can even filter here, right? And I can say where in the last 28 days I got to get past the zeros here where was was my content sitting. I got lots of zeros here and I can add a filter. I can add a query. Here we go. So now I can start to see. OK what’s ranking in the top and I got too many columns going on here and it’s not picking up from my screen but I can start to see what positions are ranking high and if I go and I probably extended this a little too long just because I’m not using my big screen I can start to see which content is actually ranking.
Number one, and if I want just to clean this up here I can go. I can get rid of the clicks I can get rid of the that and then I can just look at the position part here. So now I can see all on one screen what what is ranking and so why C is actually you know some of the stuff is high very quickly. And then you’ve also got some stuff I wrote about Kendrick Lamar, which is in the top 10 on specific searches. So really fascinating way to figure out how quickly content ranks if you have, you know I’m like OK these these album reactions they drive.
Because a lot of people are searching for them and it’s trending. It actually drives a lot of engagement and growth. And because I’ve got you know, this video on YouTube. It’s good content. People can spend time on the page etcetera etcetera. So lots of really interesting things right there and then gives me a couple opportunities. And obviously I’m just taking a quick look at this. But I could spend a lot of time sort of figuring this out, filtering the information for what I’m looking for, and then figure out what content do I want to make in June here. So pop into another spot which is LinkedIn, which is where.
I’ve been creating a lot of content and they I mean they do not have very good analytics tool. I did a quick look here about it and really you’re looking at one video at once to see the analytics on it and then sort of the post analytics too. From my perspective I can go down, I can find OK. Is there any that have a little bit more views? So this was that why? Comment letter to founders which overall seemed to have a little bit more engagement and views and I can click this and I can see video performance 187 so.
That’s quite a bit of time. People are watching it 200 lifetimes in 191 viewers, so I can look at the previous seven days. I can look at weekly which is basically going to be the same and then I can also see the companies that are looking at it the the people, the titles of those companies and then where they’re located so can also give me some interest of. OK, interesting. So these are some of my connections. Some of my friends on LinkedIn. They’re checking out the content that’s great to know, and then overall, what is the main title of the people who are watching these videos so that I can start to use that?
And then optimize videos. OK, I know a lot of founders are watching these videos. What can I? How can I use that to create content that’s more valuable to founders knowing that there are, you know, highly valuable audience and the kind of people that I want to connect with. So again, very quick, brief through this, but you can already see a couple sort of possible paths to insights that then allow you to then prioritize and optimize content moving forward. And then I’ll hop into analytics. And so I’ve got a filter view here. Not going on much, and you know one thing I really noticed when I was just in that Google search.
And so someone would notice like impressions, year over year are down and I was publishing a lot more content last year and then have started to ramp up again now. But overall a lot of that content that I had been had posted while it was still some of it was still ranking over all impressions and positions and stuff was starting to entropy so. So that idea of continuing to refresh and create new content is one that is very important and valuable. If you want to keep that momentum, keep the tractions. Keep keep the engagement up. So now I am in the actual analytics system. This universal analytics system is shutting down in.
2023 it’s not even that far, so I’ve got to set up in the new GTA4, which I haven’t done. But this is all good. High level audience overview. OK, great again. I think some things make sense, but unless you start to compare you really don’t get that much insight. So it’s great to look at a metric, but unless you have some sort of time period or comparison, it starts to not really make that much sense. So users up sessions up. Fantastic bounce rate.
However, is also up in overall page views and pages per sessions are down South. That most likely what I derive from that is, it’s great. I’ve got some new users, but a lot of these might just be coming and checking out one piece of content that maybe I shared somewhere and then they’re bouncing off that pretty quickly. So how can I lower that bounce rate? What can I do to increase the stickiness of the site and other content that connects it, etcetera etcetera to make sure that people aren’t bouncing that maybe making sure that people are visiting multiple pages per session?
Those are challenges and things that I have to ask myself. So there are so many layers of insights that you can go on to here. But what I’d like to do is take a look at two things. I would say all source medium and this gets a little messy here. So I’m actually going to move the the compare. I’m just going to look at this in general. I start to see OK. Here’s the sources. Whereas what’s driving the most users. But then because I’ve got a couple. I mean in this view I’ve actually got one goal. I can start to say.
Where was the most goals completed? Which it was Google search console, fantastic or sorry Google search and then I can actually see what was the highest conversion rates for these goals too. So it’s hard when you’ve got a very small sample size, it doesn’t make too much of a a piece here, and an outbound link might be the most not. Might not be the most optimized goal for me, so there’s another view I can see. County link clicks things like that and that allows me to then optimize even further, and so I’ll spend some time looking at this, seeing what sources.
If there’s anything that’s you know valuable from that also, looking from a referral basis, which could give me a little bit more detail, sort of insights into where exactly those people are coming from. There’s the idea to look at social. You can see LinkedIn being the biggest driver, which makes sense considering the amount that I share. And then I also like to take a look at that landing page because in Google Search console we could look at those landing pages, but they were really just showing organic traffic, whereas this could show a little bit more. So you can also see in the same way the.
Amount of sessions that are doing and then you could add, you know you could add a secondary dimension in here and say source so you want to say hey, I’m very interested in this page specifically, but I want to look at what source is you know? How do people actually get there so I can hop in? Jump in? Source medium into a secondary dimension and now I can see most of it was Google search with one nice Bing and one nice DuckDuckGo. So thank you DuckDuckGo, and I mean there’s so much more here. I do have all the events oops layered in here. Let’s see, I didn’t want too many clicks at once, so I’ve got these top events.
And I think let’s see, OK cause I’ve only got it in this one, so I’ll hop into this Google data studio. Then where we can actually jump and see this is pulling in the all website data view. You can see the outbound links that were going there and then you can see the actual event label. So this was the link that was getting clicked on most so generally when I am sharing content I will link the resources. Sometimes in a nice way, sometimes just in a pretty sloppy way. But it can start to see the content that people are most interested in.
And then I can also take a look and say hey, someone clicked on my calendar link and I can unlock and follow that entire path to how they got to that calendar thing. So you know, I’m at already at 15 minutes overview here. I went through this pretty quick, lots of different ways to actually filter out this information show what’s, you know, show what’s working, show what’s not the kind of content that is ranking the kind of content that is not, but you can see you know, even at a small sample size, there is a lot that you can learn and. Very quickly start to figure out. OK, what’s working. What’s working best. What’s working. What’s not working, and how do I make the the next month? Even better than this last one, so I’m at the end of my time here. That was a quick 15 minutes. I hope you learn something from this of just the path that I had and thank you as always, for checking this out. It’s been a fun month. Let’s make the other one good too. Bye bye.